How to access Overall Progress
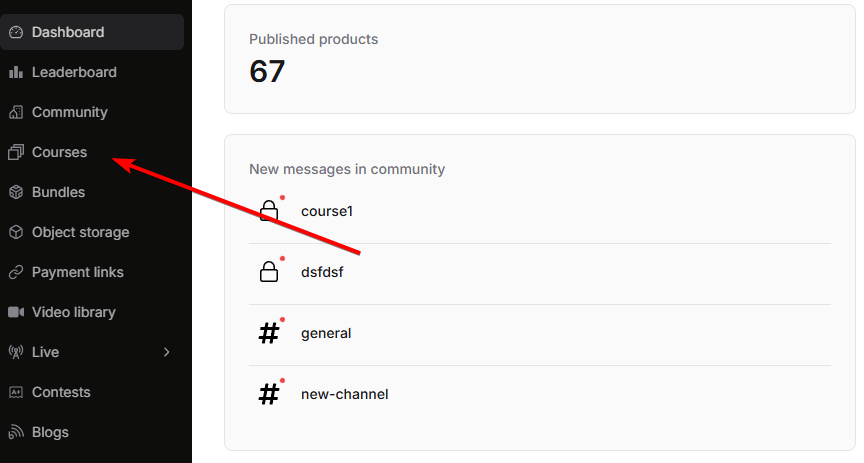
Select the course
Click on the course for which you want to view overall student progress analytics.

Open the Students tab
You will find the 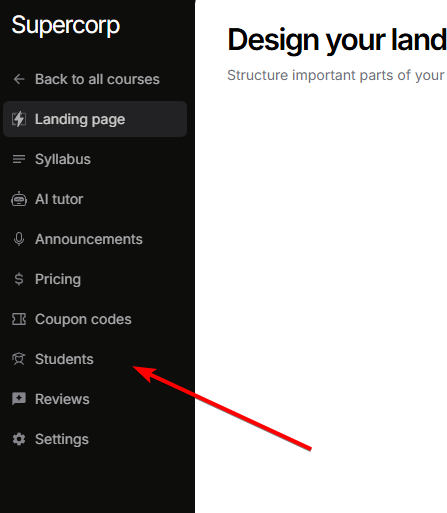
students tab in the left sidebar of the course page. Click on it to access student management.

Course content and completion progress
Below the summary metrics, you’ll find a detailed table showing completion progress for each course item across all enrolled students. The table includes three columns:Course content
The first (leftmost) column shows a structured list of all items in your course, clearly grouped by their section. Each section is then expanded to display its included content—such as videos, articles, assignments, interactive labs, and more. This makes it easy to quickly scan everything that makes up your course curriculum.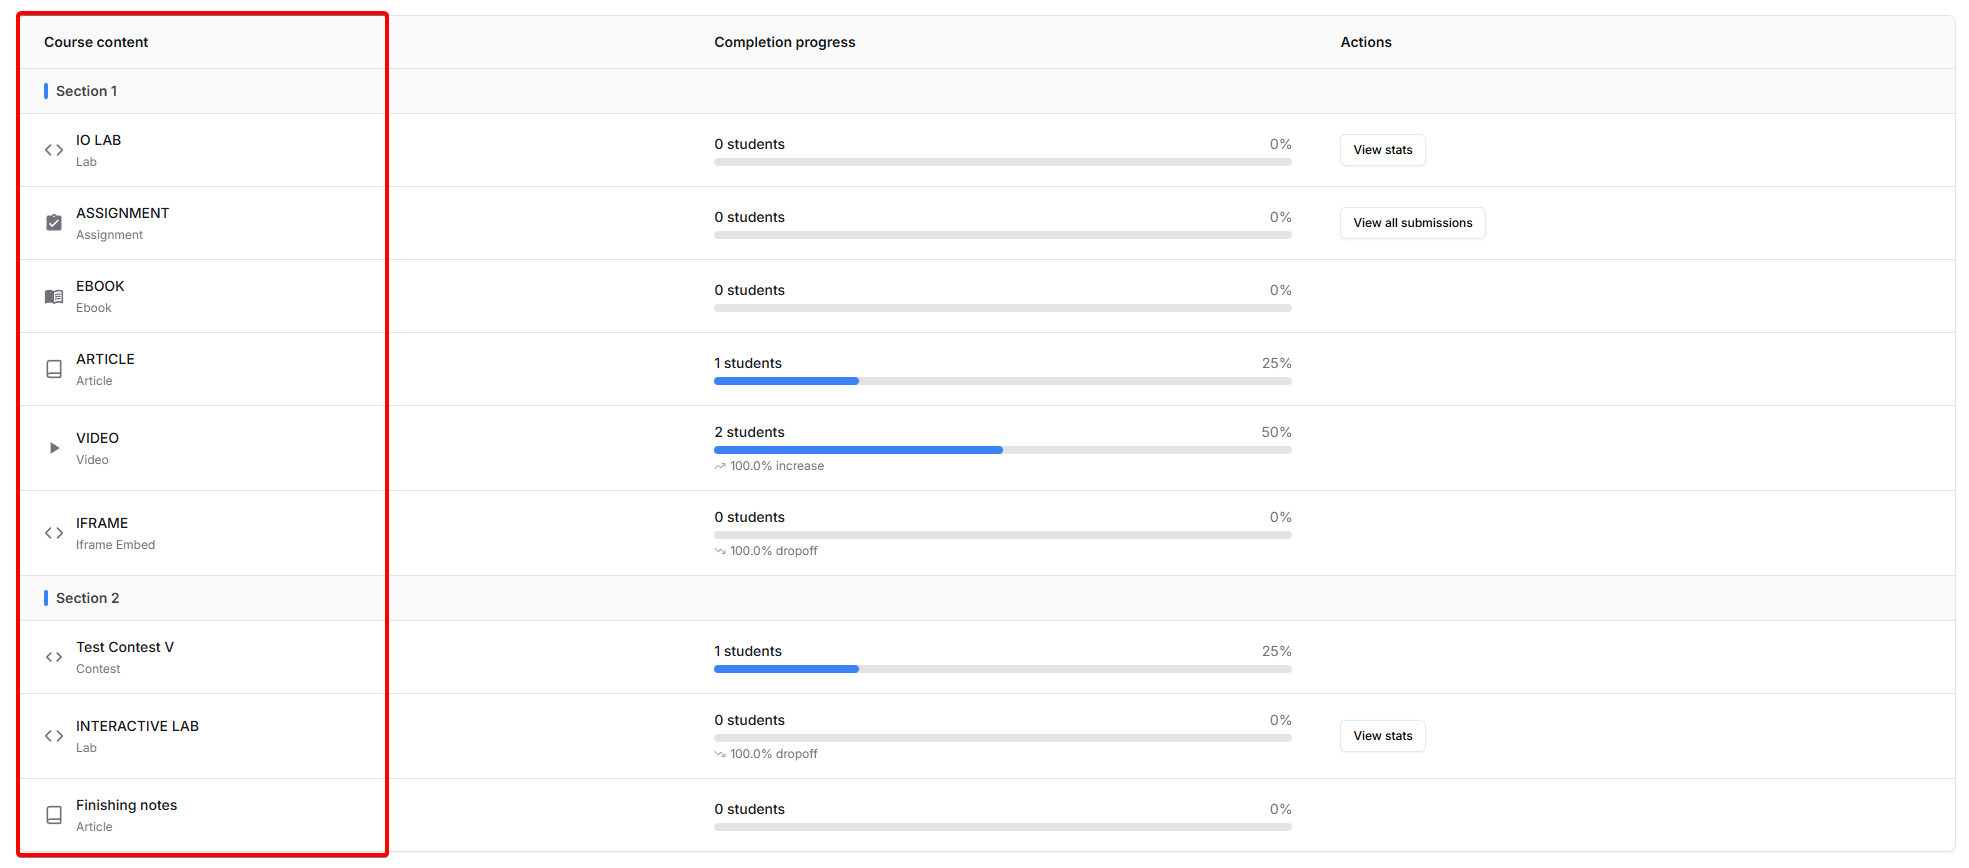
- Section names are shown as headings, with a collapsible or indented list of course items underneath.
- Common content types (e.g., quizzes, labs, videos, articles, assignments) are all listed, matching the course’s order and structure.
- Every listed item corresponds directly to a row in the completion/progress columns to its right.
Completion progress
 The center column summarizes progress for each course item across all enrolled students, including:
- Student count: The number of students who have completed the item (displayed as “X students”).
- Completion percentage: Displays as a percentage out of all active enrollments.
- Progress bar: A horizontal bar visually represents the current completion percentage for each item.
- Change indicators: If a shift has occurred since the previous measurement period, you’ll see either:
- A percentage increase (e.g., “25.0% increase”)
- A percentage decrease/dropoff (e.g., “10.0% dropoff”)
- Or “No change” when completion remains the same
Actions
The rightmost column offers context-aware action buttons:- View stats: Shown for coding labs and interactive/IO lab items; opens a detailed statistics panel for that content item.
- View all submissions: Shown for assignments; opens a full list of all student submissions collected for that task.
- Actions only appear where relevant, so the interface stays uncluttered for standard videos, articles, or quizzes.
Using overall progress analytics
The Overall Progress view helps you:- Identify engagement patterns: See which types of content (videos, articles, labs) students engage with most
- Spot problematic content: Identify course items with low completion rates or high dropoff rates
- Track improvements: Monitor completion changes over time with increase/decrease indicators
- Optimize course structure: Use completion data to reorganize or improve content that students struggle with
- Make data-driven decisions: Use metrics to decide which content types to add more of or modify